In this paper we outline the stakeholder-led approaches in the development of biological data products to support effective conservation, management and policy development. The requirements of a broad range of stakeholders and iterative, structured processes framed the development of tools, models and maps that support the FAIR (Findable, Accessible, Interoperable, Reusable) data principles. By structuring the resultant data products around the emerging biological Essential Ocean Variables, and through the engagement with a broad range of end-users, the EMODnet (European Marine Observation and Data Network) Biology project has delivered a suite of demonstration data products. These products are presented in the European Atlas of Marine Life, an online resource demonstrating the value of open marine biodiversity data and help to answer fundamental and policy-driven questions related to managing the natural and anthropogenic impacts in European waters.
The portal shares scientific commentary and analysis and provides access to information on various initiatives, highlighting the scale and scope of response and encouraging ISC members and partners to collaborate and share best practices during this global emergency.
Please note that the World Health Organization is providing rolling updates on the crisis. Click here.
You will find in this portal:
Information on responses by scientific communities in different fields and different countries/regions of the world. Click on Institutional Responses for the full list.
Access to rapidly emerging scientific debate on the pandemic. Click onScientific Debates to engage in the discussion.
To participate in the discussion, or to share your COVID19 initiatives to this portal, please fill out the submission form.
Quantifying the presence and environmental impact of invasive species is the starting point for research on management and nature conservation. North American beavers (Castor canadensis) were introduced to Argentina from Canada in 1946, and the species has been identified as a major agent of environmental change in the Tierra del Fuego archipelago in the Anthropocene.
We studied the invasion status (distribution and density) of beavers through analyses of the dam densities in the Tierra del Fuego landscapes. We identified beaver dams with a GIS using visual interpretation of high-resolution aerial imagery from Microsoft Bing, Google Earth and HERE and related them to natural environmental gradients. These factors comprised geographic (vegetation zones and distance to streams), climatic (temperature, precipitation, evapotranspiration and net primary productivity) and topographic (elevation and slope) data.
The datasets (dams and factors) were combined, and the data from the different zonation classes were subsequently compared using ANOVAs and Tukey’s mean comparison tests. Deviations from the mean density (x mean density—x total mean density) were calculated to visualize the deviations for the studied factors. The datasets were also evaluated using principal component analyses (PCA).
Our results showed a total of 206,203 beaver dams (100,951 in Argentina and 105,252 in Chile) in the study area (73,000 km2).
The main island of Tierra del Fuego presented a greater degree of invasion (73.6% of the total study area) than the rest of the archipelago, especially in areas covered by mixed-evergreen and deciduous forests.
The studied geographic, climatic and topographic factors showed positive trends (higher beaver preference) with beaver spread, which were all significant (p <0.05) when compared across the landscape.
Although beavers are flexible in their habitat use, our empirical records showed that they had marked preferences and were positively influenced by the most productive forests.
Here, we describe a scientific panorama that identified the drivers of species invasion based on satellite data and the available ecological datasets. The identification of such drivers could be useful for developing new tools for management and/or control strategies of the beavers in the Tierra del Fuego archipelago.
Distribution of the analyzed geographic (A-B), climatic (C-F) and topographic (G-H) factors on the Tierra del Fuego archipelago.
The Group on Earth Observations (GEO) and UN-Habitat are building an “Earth Observation Toolkit for Sustainable Cities and Communities” Programme designed to support UN Member States, including cities, in achieving the United Nations Sustainable Development Goal (SDG) 11 to “make cities and human settlements inclusive, safe, resilient and sustainable,” and to implement the New Urban Agenda (NUA) through sustained utilization of Earth observation (EO) data and applications.
The Programme aims to develop a customizable and continually updated toolkit on the integration of Earth observation and geospatial information into the urban monitoring and reporting processes on SDG targets and indicators based on inputs from UN Member States and cities.
The toolkit, developed through a consultative process with countries and cities, will complement guidance published by UN-Habitat, and will be produced in conjunction with UN-Habitat and a selected number of regionally representative countries and cities. It will define needs, data requirements, and provide practical guidance on the integration of remotely sensed and ground-based EO data with national statistics, socioeconomic data, and other, ancillary information to help countries monitor, report, and drive progress on SDG 11 and the NUA. The “EO Toolkit for Sustainable Cities and Communities” Programme will facilitate knowledge sharing, connect national, sub-national, and city experiences, and foster understanding between technical analysts and decision makers regarding the role and potential contributions of EO in support of SDG 11 and the NUA.
Key areas will include but will not be limited to: monitoring urban expansion and densification, tracking accessibility to public transport, taking stock of open public spaces and their distributions across urban extents, mapping slums, informal settlements and inadequate housing conditions, assessing enviro-climatic conditions and spatial typology as well as urban vulnerabilities, and reducing the adverse per capita environmental impacts of cities, including air quality.
The programme will illustrate guidance and use cases on how EO technologies and advances in cloud computing platforms are applied to enable fast and cost effective access to, and use of, EO by countries, cities, and local communities. Special emphasis will be applied to analysis ready data, open data cubes, training data sets and Artificial Intelligence (AI) and Machine Learning (ML) techniques to harness EO for decision makers.
GEO Members, and interested cities from Member countries, are invited to contribute to the design and implementation of this toolkit, in accordance with their needs and priorities. A selected list of regionally representative countries, and interested cities from those countries, will participate in a Steering Committee that will serve for a period of one year, with the possibility for renewal. The Steering Committee, consisting of the selected countries and cities from those countries, UN-Habitat, EO providers, and representatives of GEO urban-related activities, will meet (in person or virtually) as needed, and consult electronically between meetings. The participating countries and cities will act as case studies and demonstration pilots to showcase how the toolkit is used to support their monitoring, reporting, and planning activities in relation to SDG 11, the NUA and other, identified urban-related priorities.
Becoming part of the “EO Toolkit for Sustainable Cities and Communities” Programme will contribute to the expedited use of EO data, applications, and tools and their integration with statistical and other data sources, with the ultimate goal of accelerated monitoring of trends at the city/urban, national, regional, and global levels.
Additional benefits to individuals and organizations include:
Joining a global network of experts and practitioners from national/ sub-national, regional or thematic initiatives, where methods, lessons learned, good practices, and experiences in geospatial information and EO-integrated SDG efforts of relevance to SDG 11 and the NUA can be shared;
Helping drive progress towards urban sustainability in your country and cities that choose to support the programme;
Working at a national level to coordinate activities and ensure communication and collaboration around the national urban agenda and associated priorities;
Receiving direct technical support and capacity development from GEO, UN-Habitat, and EO providers (Space Agencies), including on the replication of global approaches using local datasets to support their monitoring, reporting, and planning activities in relation to SDG 11 and the NUA,
Addressing the GEO Plenary with illustrations of end-to-end applications of EO in country and city use cases; and,
Becoming a global reference point and “go to” place for city to city and country to country learning.
To learn more about the programme, including assessment criteria and full details on how to join, please download the Application Form here.
But during March and April this year there was a notable zone of depleted ozone — which protects life from the sun's ultraviolet radiation — over the Arctic, too. It closed last week, though it wasn't nearly as robust as the annual Antarctic ozone hole, and it certainly wasn't a big health threat to humanity. (Though it’s always wise to diligently use sun protection, regardless of the ozone layer's condition.)
"It’s unusual but not unexpected," Paul Newman, the chief scientist in the Earth Sciences Division at NASA's Goddard Space Flight Center, said of the recent Arctic ozone hole.
"It’s unusual in that we only have events like this about once per decade," Newman added.
There are two other years on record, 1997 and 2011, when there were similar ozone depletions over the Arctic, explained Antje Innes, a senior scientist at the European Union's Copernicus Atmosphere Monitoring Service. But recent measurements suggest the ozone levels were even lower this year, she said.
Importantly, these recent ozone numbers aren't nearly as low as they are in Antarctica's slowly healing, big ozone hole, which opens up in August through October each year.
"These two are really different animals," said NASA's Newman. "This [Arctic ozone hole] is not comparable to the Antarctic ozone hole."
"If this was happening over the Antarctic we would be shouting for joy," he added, referencing the still significantly lower ozone numbers over Antarctica caused by decades of releasing ozone-depleting gases, like chlorofluorocarbons, or CFCs, into the atmosphere. (Fortunately, scientists discovered the Antarctic ozone hole in 1985, and CFCs were soon banned.)
For reference, on Oct. 12, 2018, ozone levels plummeted to 104 Dobson units (the measurement of ozone in the atmosphere) over Antarctica versus 205 Dobson units over the Arctic on Mar. 12, 2020. (Typically, ozone levels don't drop below 240 Dobson units in the Arctic during March.)
The unprecedented 2020 northern hemisphere #OzoneHole has come to an end. The #PolarVortex split, allowing #ozone-rich air into the Arctic, closely matching last week's forecast from the #CopernicusAtmosphere Monitoring Service.
Ozone columns over large parts of the Arctic have reached record-breaking low values this year, and the ozone layer over the Arctic is severely depleted at altitudes of around 18 km. The last time similarly strong chemical ozone depletion was observed over the Arctic was during spring 2011, and ozone depletion in 2020 seems on course to be even stronger.
The Copernicus Atmosphere Monitoring Service (CAMS*) has been closely following the rather unusual ozone hole that has formed over the Arctic this spring.
Timeseries of Northern Hemisphere ozone column minimum (in Dobson Units) from CAMS (2003–2020) and C3S (1980–2002) data (shown are the two years with respectively the highest column minimum and lowest column minimum for each decade) illustrating how exceptionally low the ozone column minimum values have been so far in 2020 (black line). (Credit: CopernicusECMWF)
While we are used to ozone holes developing over the Antarctic every year during the Austral spring, the conditions needed for such strong ozone depletion are not normally found in the Northern Hemisphere. The Antarctic ozone hole is mainly caused by human-made chemicals including chlorine and bromine that migrate into the stratosphere – a layer of the atmosphere around 10–50 kilometres above sea level. These chemicals accumulate inside the strong polar vortex that develops over the Antarctic every winter where they remain chemically inactive in the darkness. Temperatures in the vortex can fall to below -78 degrees Celsius and polar stratospheric clouds (PSCs) can form, which play an important part in chemical reactions involving the human-made chemicals that lead to ozone depletion once sunlight returns to the area. This depletion has been causing an ozone hole to form annually over the last 35 years, but the 2019 Antarctic ozone hole was actually one of the smallest we have seen during that time.
The Arctic stratosphere is usually less isolated than its Antarctic counterpart because the presence of nearby land masses and mountain ranges disturbs the weather patterns more than in the Southern Hemisphere. This explains why the polar vortex in the Northern Hemisphere is usually weaker and more perturbed than in the Southern Hemisphere, and temperatures do not fall so low. However, in 2020 the Arctic polar vortex has been exceptionally strong and long lived. Furthermore, temperatures in the Arctic stratosphere were low enough for several months at the start of 2020 to allow the formation of PSCs, resulting in large ozone losses over the Arctic.
Timeseries of minimum temperature (north of 60⁰N) in the stratosphere at an altitude where the pressure measures 50 hPa. Data are from CAMS (2003–2020) and C3S (1980–2002). The two years shown for each decade are those with the highest column minimum and lowest column minimum, illustrating that minimum stratospheric temperatures at 50 hPa during winter and spring 2020 (black line) were below the temperature threshold for PSC formation (-78 degrees Celsius) for several months. (Credit: CopernicusECMWF)
Ozone depletion over the Arctic in 2020 has been so severe that most of the ozone in the layer between 80 and 50 hPa (an altitude of around 18 km) has been depleted.
Left panel: Comparison of ozone profiles (in millipascals) from CAMS (red) and independent ozonesonde instruments (black) at the Arctic station of Ny-Ålesund on 26 March 2020. Right panel: Mean ozone profiles at Ny-Ålesund from CAMS (yellow/orange) and ozonesondes (black) averaged over the years 2003–2019. The shaded area denotes +/- 1 standard deviation. (Credit: Copernicus Atmosphere Monitoring Service, ECMWF)
CAMS will continue to monitor the evolution of the Arctic ozone hole over the coming months. Our forecasts suggest that temperatures have now started to increase (see temperature graph above) and observations from the Microwave Limb Sounder instrument on NASA’s Aura satellite show that the stock of active chlorine is exhausted so that ozone depletion will slow down and eventually stop. Once the polar vortex breaks down, ozone-depleted air will mix with ozone-rich air from lower latitudes.
CAMS monitors the ozone layer by combining information from its detailed numerical models of the atmosphere with satellite and ground-based (in situ) observations through a process called data assimilation. Currently, CAMS uses ozone satellite observations from the SBUV-2, OMI, MLS, GOME-2 and Sentinel-5P/TROPOMI instruments.
* CAMS is implemented by the European Centre for Medium-Range Weather Forecasts on behalf of the European Commission.
On 27 April, the old Earth Online website retired, to make space for this brand new portal—still intending to serve Earth Observation scientists and experts worldwide.
Earth Online was first released some 30 years ago, in the 1990s (at that time entitled ESA Earth Observation Guide & Directory Service). It was among the first ESA websites on the net, and has been the entry point for scientific-technical information on Earth Observation (EO) activities, carried out by ESA.
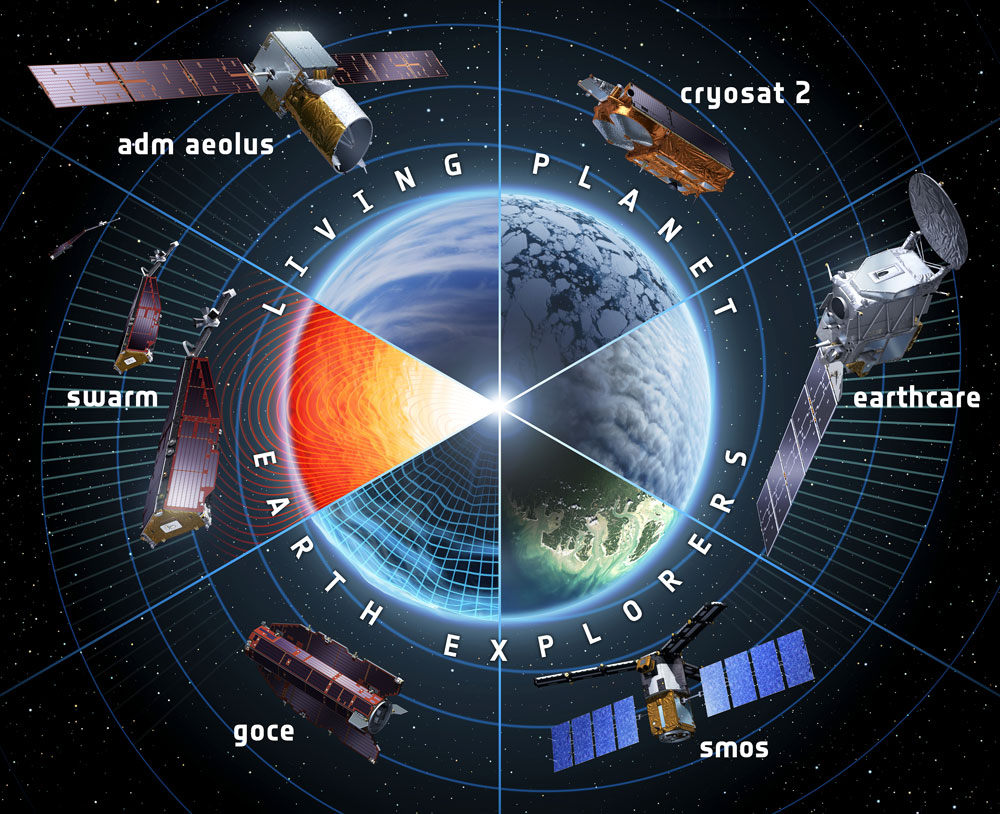
The website contains information dating back to ESA’s first EO programme - ERS (European Remote Sensing); on currently operational missions including CryoSat, SMOS and Swarm, through to the latest missions under development, such as Biomass, EarthCARE and FLEX.
Aimed at Earth observation data users, but addressing organisations and individuals with a specific interest in EO as well, Earth Online also provides the latest technical news on ESA and Third Party Missions (TPM), workshops and many more topics. Through agreements with other space agencies, ESA offers data products from over 40 international missions in the TPM programme.
Earth Online provides a vast amount of content, collected over some two decades, including: detailed technical information on EO missions; information on satellites and sensors; EO data products and services; online resources such as catalogues and a library; applications of satellite data and access to promotional satellite imagery.
It also provides access to TellUS, a service management portal and platform for ESA's Earth observation payload data users, which allow users to explore ESA's Earth Observation Knowledge Base, request services and report issues to ESA's Earth Observation Help and Order Desk (EOHelp), as well as query their status.
Among its many services is also EO-CAT—the Next Generation Earth Observation system, designed to manage end-user Earth Observation services. Using the Generic Catalogue Services, one can browse the metadata and images of Earth Observation data, acquired by various satellites.
Since January 2012, it has also integrated all information related to the Principal Investigators (PI) community – those scientists who were first designated to study how to best use the data and their applications– including a workflow management component (PI workflow) used for processing special requests for access to Earth Observation data, as well as for helping disseminate research results based on those data.
In addition, the website provides details of airborne campaigns that have been conducted since 1998, many of which support the development of future missions or the validation of instruments carried aboard operating satellites.
Mission managers, data users and the web management team realised it was time to bring a fresh view and novelty to the website, and so for the past two years this team has been working hard to come up with the best possible solution.
With a mobile responsive design, this new Earth Online presents a straightforward navigation system and interconnection between content.
Central to this new design is a powerful search functionality. With information dating back 30 years, the aim is to make it easier for all to find the resources they seek. The result is a simplified navigation, which primarily prioritises the data, news and missions.
Within a few clicks, you can find what you need either using a text search, or a series of filters that narrow down your search results by thematic areas, missions and instruments.
Another enhancement in the navigation involves interconnecting the contents of the website where relevant. Through mission pages, for example, you can find information about the mission, followed by available data, together with the tools you may use to visualise or exploit that data.
This interconnection also extends to the integration of another website, the Sensor Performance, Products and Algorithms (SPPA) website. The SPPA website is dedicated to providing information about quality control, calibration and validation of ESA's EO instruments, along with related events and activities.
With a natural connection between the two sites, the SPPA website is now part of the new Earth Online, and the information about the instruments has been merged with the relevant pages, further easing access to the relevant resources.
The objective and continuous views of our planet, supplied by satellite images and data, provide scientists and decision makers with the information they need to understand and protect our environment. This has and will continue to be the main goal for this new website.
"We can proudly say that ESA shall continue to share a wealth of data and information in Earth Observation with its worldwide users, through our now upgraded legacy website - Earth Online," states ESA's Common Services Web Team.


bit.ly/39JQRU8